Moving Towards Best Practice: Dispelling Statistical Myths
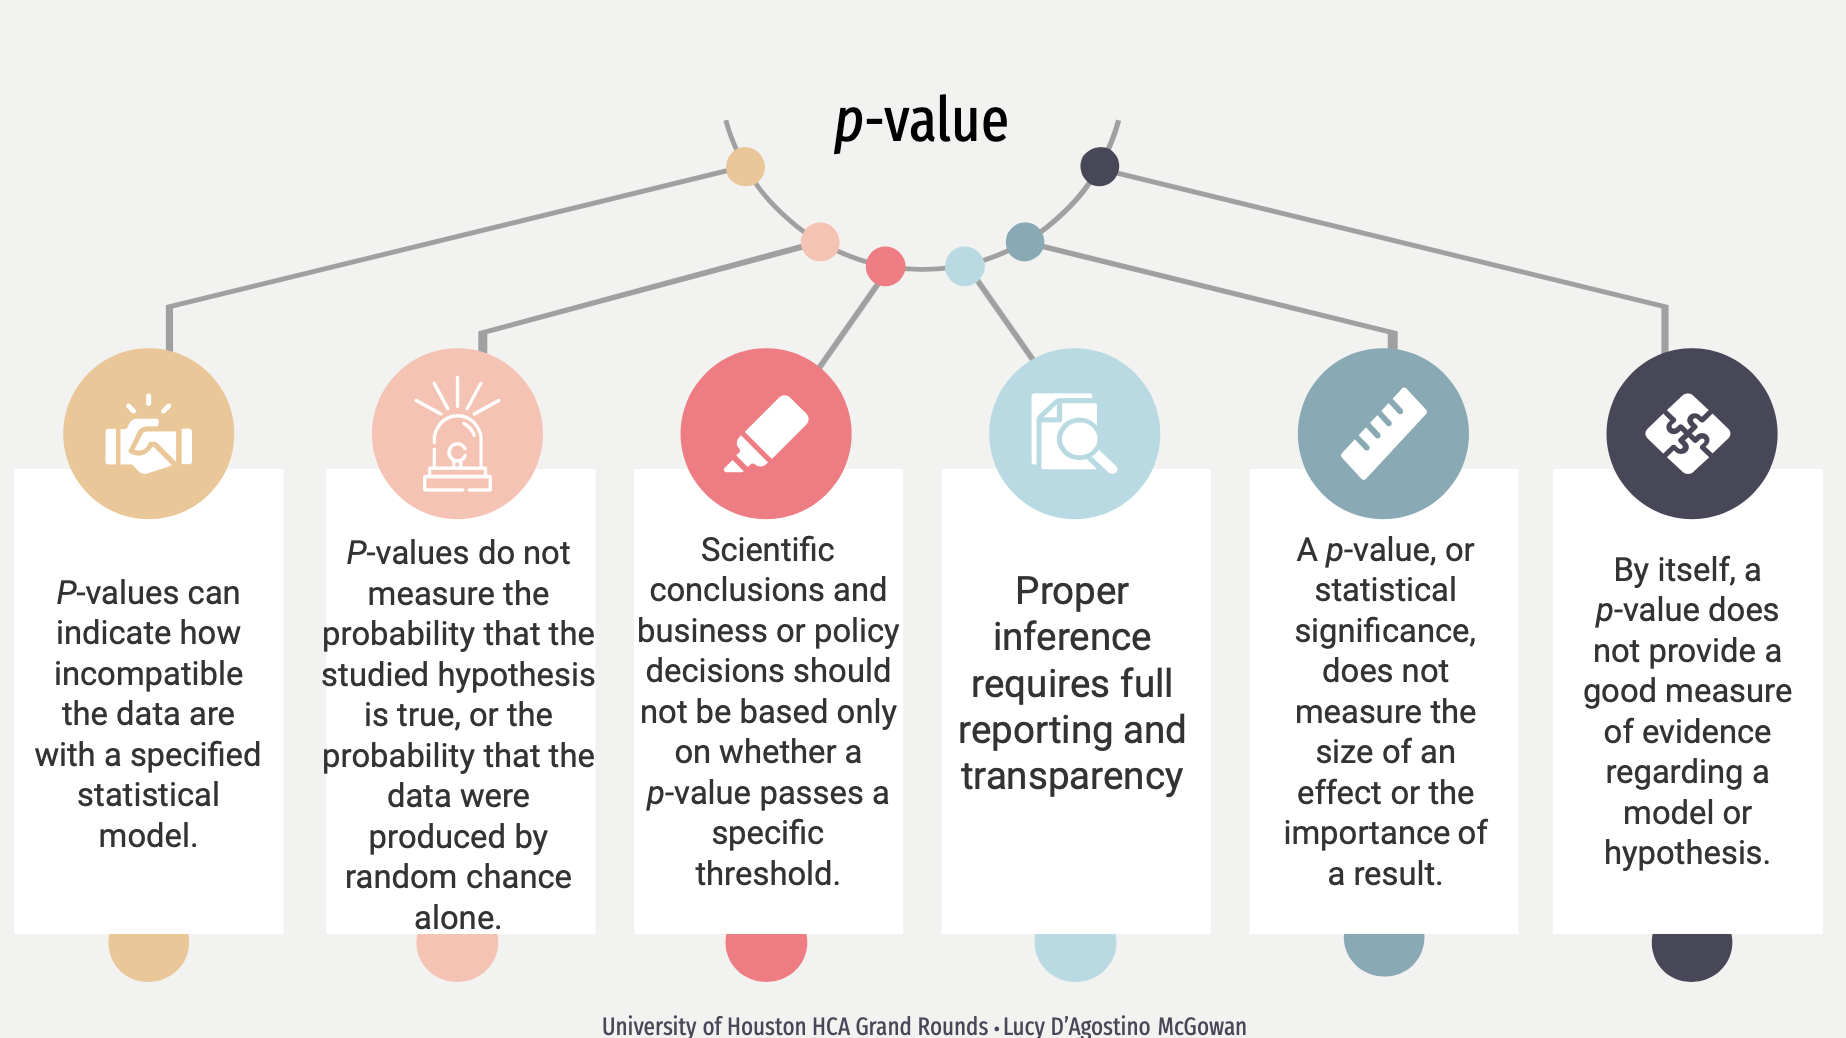
This talk will focus on best practices for using modern statistics in health sciences.
This talk will focus on best practices for using modern statistics in health sciences.

A data jamboree is a party of different computing tools solving the same data science problems. The NYC Open Data of 311 Service Requests contains all 311 requests of NYC from 2010 to present. This talk with demonstrate how to analyze this data using R.
The data revolution has sparked greater interest in data analysis practices. While much attention has been given to statistical thinking, another type of complementary thinking that appears in data analysis is design thinking – a problem-solving approach focused on understanding the intended users of a product. When facing a problem, differences arise in how data analysts construct data analyses, including choices in methods, tools, and workflows. These choices impact the analysis outputs and user experience. Therefore, a data analyst’s role can be seen as designing the analysis with specific principles. This webinar will introduce six design principles for data analysis and describe how they can be mapped to data analyses in a quantitative and informative manner. We also provide empirical evidence of variation of these principles within and between data analysts. This will hopefully provide guidance for future work in characterizing the data analytic process.

The data revolution has sparked greater interest in data analysis practices. While much attention has been given to statistical thinking, another type of complementary thinking that appears in data analysis is design thinking – a problem-solving approach focused on understanding the intended users of a product. When facing a problem, differences arise in how data analysts construct data analyses, including choices in methods, tools, and workflows. These choices impact the analysis outputs and user experience. Therefore, a data analyst’s role can be seen as designing the analysis with specific principles. This webinar will introduce six design principles for data analysis and describe how they can be mapped to data analyses in a quantitative and informative manner. We also provide empirical evidence of variation of these principles within and between data analysts. This will hopefully provide guidance for future work in characterizing the data analytic process.

Missing data is a common challenge when analyzing epidemiological data, and imputation is often used to address this issue. In this talk, we investigate the scenario where covariates used in an analysis have missingness and will be imputed. There are recommendations to include the ultimate outcome in the imputation model for missing covariates, but it’s not necessarily clear when this recommendation holds and why this is true. We examine deterministic imputation (i.e., single imputation where the imputed values are treated as fixed) and stochastic imputation (i.e., single imputation with a random value or multiple imputation) methods and their implications for estimating the relationship between the imputed covariate and the outcome. We mathematically demonstrate that including the outcome variable in imputation models is not just a recommendation but a requirement to achieve unbiased results when using stochastic imputation methods. Moreover, we dispel common misconceptions about deterministic imputation models and demonstrate why the outcome should not be included in these models. This talk aims to bridge the gap between imputation in theory and practice, providing mathematical derivations to explain common statistical recommendations. We offer a better understanding of the considerations involved in imputing missing covariates and emphasize when it is necessary to include the outcome variable in the imputation model.
Invited sessions at conferences provide important opportunities for the exchange of ideas. But how do we get invited? And how can we do the inviting? In this panel, we bring together experienced women in statistics from all career stages to share their tips on organizing invited sessions. Our panelists have planned and participated in numerous successful invited sessions at statistical conferences and have served on program committees to plan and select these sessions on a large scale. This session, sponsored by the Caucus for Women in Statistics, is intended to demystify the invited session proposal process and to empower researchers to submit their ideas in the future.
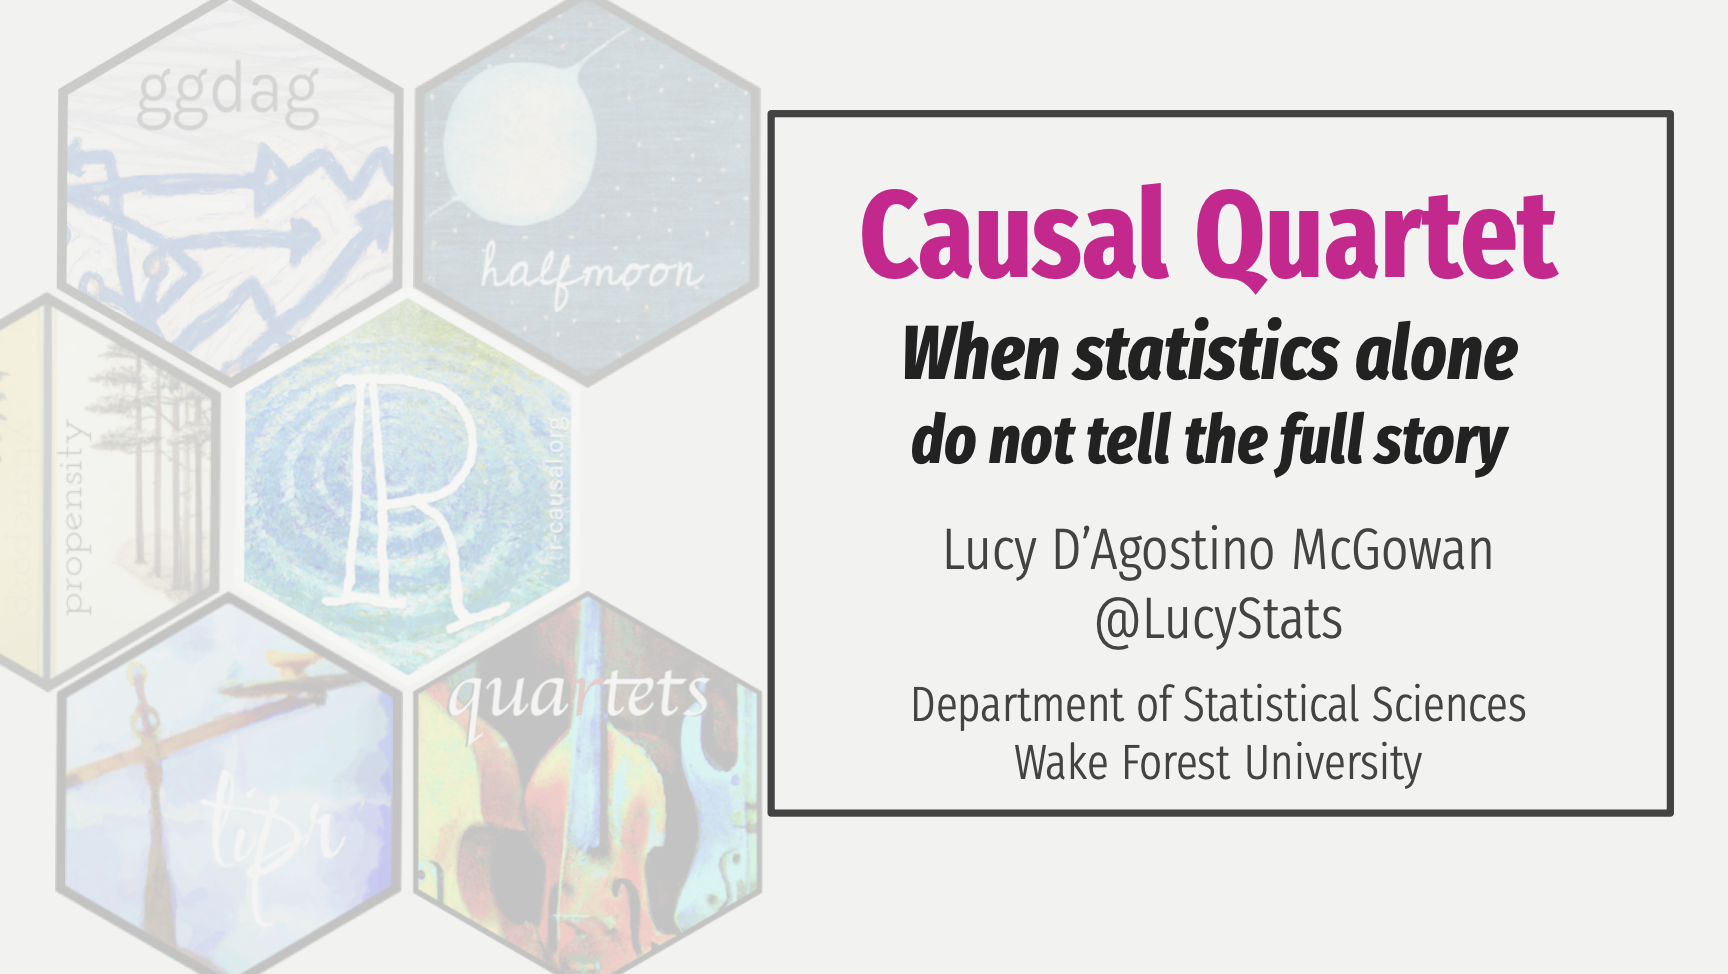
This talk will delve into two major causal inference obstacles: (1) identifying which variables to account for and (2) assessing the impact of unmeasured variables. The first half of the talk will showcase a Causal Quartet. In the spirit of Anscombe’s Quartet, this is a set of four datasets with identical statistical properties, yet different true causal effects due to differing data generating mechanisms. These simple datasets provide a straightforward example for statisticians to point to when explaining these concepts to collaborators and students. The second half of the talk will focus on how statistical techniques can be leveraged to examine the impact of a potential unmeasured confounder. We will examine sensitivity analyses under several scenarios with varying levels of information about potential unmeasured confounders, introducing the tipr R package, which provides tools for conducting sensitivity analyses in a flexible and accessible manner.

This talk will delve into two major causal inference obstacles: (1) identifying which variables to account for and (2) assessing the impact of unmeasured variables. The first half of the talk will showcase a Causal Quartet. In the spirit of Anscombe’s Quartet, this is a set of four datasets with identical statistical properties, yet different true causal effects due to differing data generating mechanisms. These simple datasets provide a straightforward example for statisticians to point to when explaining these concepts to collaborators and students. To adjust or not adjust, that is the question; we demonstrate that statistics alone cannot be used to establish which variables to adjust for when estimating causal effects. The second half of the talk will focus on how statistical techniques can be leveraged to address unmeasured confounding. We will examine sensitivity analyses under several scenarios with varying levels of information about potential unmeasured confounders. These techniques will be applied using the tipr R package, which provides tools for conducting sensitivity analyses in a flexible and accessible manner.

This talk covers several diagnostic plots that are helpful when attempting to answer a causal question. They can be used to visualize the target population, balance, and treatment effect heterogeneity.

In this workshop, we’ll teach the essential elements of answering causal questions in R through causal diagrams, and causal modeling techniques such as propensity scores and inverse probability weighting.