
Causal Inference in R
In this workshop, we’ll teach the essential elements of answering causal questions in R through causal diagrams, and causal modeling techniques such as propensity scores and inverse probability weighting.
In this workshop, we’ll teach the essential elements of answering causal questions in R through causal diagrams, and causal modeling techniques such as propensity scores and inverse probability weighting.
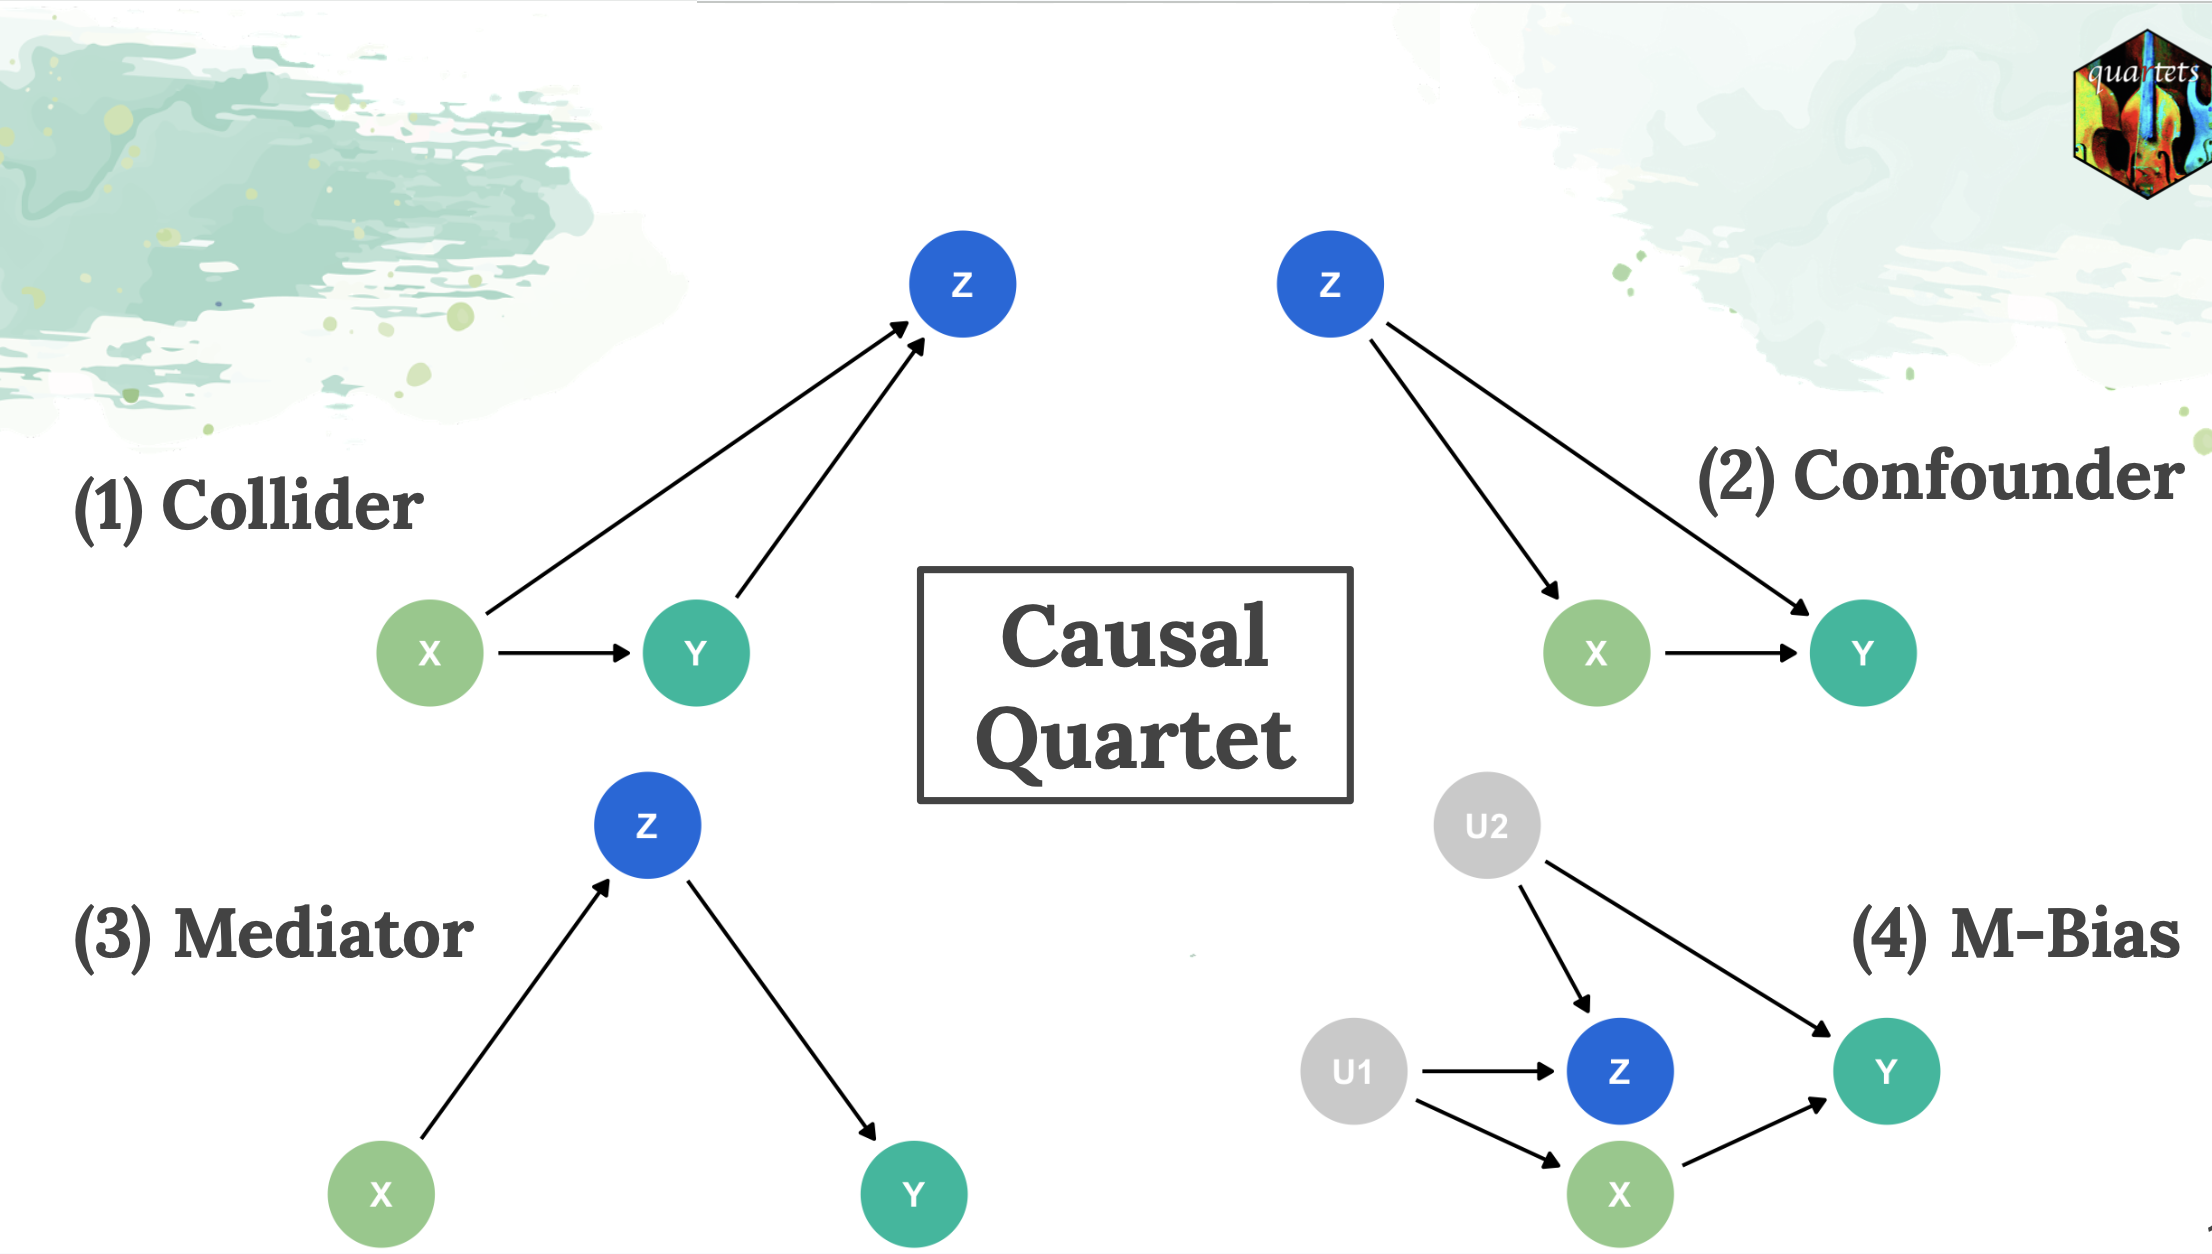
In this session, Dr. Lucy D’Agostino McGowan will discuss some of the major challenges in causal inference, and why statistical tools alone cannot uncover the data-generating mechanism when attempting to answer causal questions. As part of this talk, Lucy will showcase the Causal Quartet, which consists of four datasets that have the same statistical properties, but different true causal effects due to different ways in which the data was generated. These examples illustrate the limitations of relying solely on statistical tools in data analyses and highlight the crucial role of domain-specific knowledge.

This lecture will explore two major challenges in causal inference: (1) how to determine which variables to adjust for and (2) how to assess the impact of unmeasured variables. The first half of the talk will showcase the Causal Quartet, which consists of four datasets that have the same statistical properties, but different true causal effects due to different ways in which the data was generated. Then we will discuss sensitivity analyses for unmeasured confounders, showcasing the tipr R package.

This talk will delve into two major causal inference obstacles: (1) identifying which variables to account for and (2) assessing the impact of unmeasured variables. The first half of the talk will showcase a Causal Quartet. In the spirit of Anscombe’s Quartet, this is a set of four datasets with identical statistical properties, yet different true causal effects due to differing data generating mechanisms. These simple datasets provide a straightforward example for biostatisticians to point to when explaining these concepts to collaborators and students. Here, statistics can’t solve your causal inference problem because statistics alone cannot be used to establish which variables to adjust for when estimating causal effects. Statistics can help us explore the impact of unmeasured variables. The second half of the talk will focus on how statistical techniques can be leveraged to address unmeasured confounding. We will examine sensitivity analyses under several scenarios with varying levels of information about potential unmeasured confounders. These techniques will be applied using the tipr R package, which provides tools for conducting sensitivity analyses in a flexible and accessible manner.
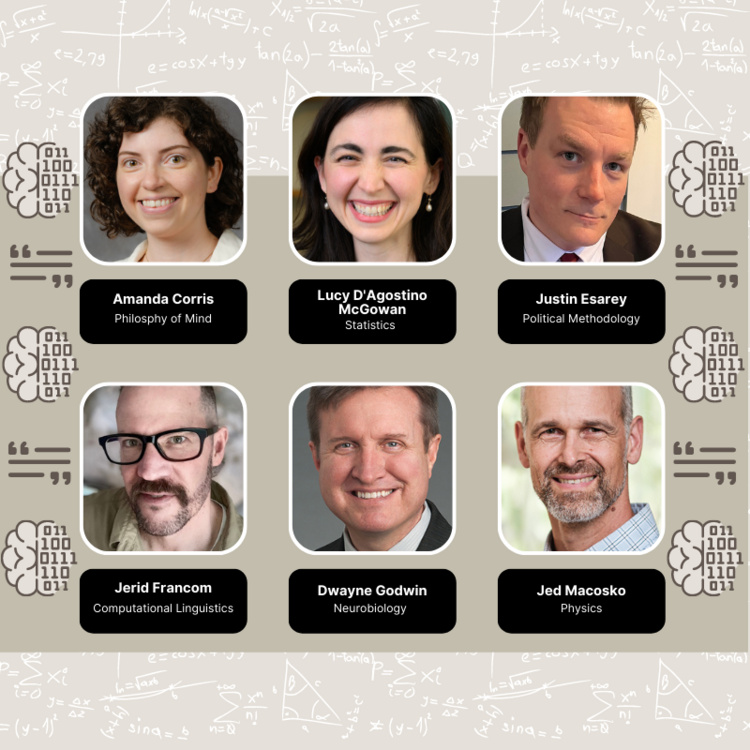
A panel of faculty experts on machine learning, language learning, neurobiology, and philosophy of mind help us understand how ChatGPT and large language models work.

The transition from graduate school to navigate the unknowns of the job market is challenging for every new statistician. Proper training, efficient networking, and building a professional profile are some of the early initiatives to prepare graduate students for this change. Statisticians are trained in modeling and data analysis; however, the real-world job market requires skills beyond technical knowledge, including communication, presentation, leadership, and collaborative skills, as well as pitching one’s ideas and goals, and being able to advocate for oneself. As a group of emerging statisticians, CENS would like to fill this gap and invite early-career statisticians to discuss the unique challenges that early-career statisticians might face in a new work environment and how to deal with them. Our panel includes both academic and industry statisticians at the MS and PhD level, several of whom graduated in the last five years. Their valuable insights and mentoring guidance will be useful for newly-emerging statisticians to build a path to kickstart their careers achieving their goals.
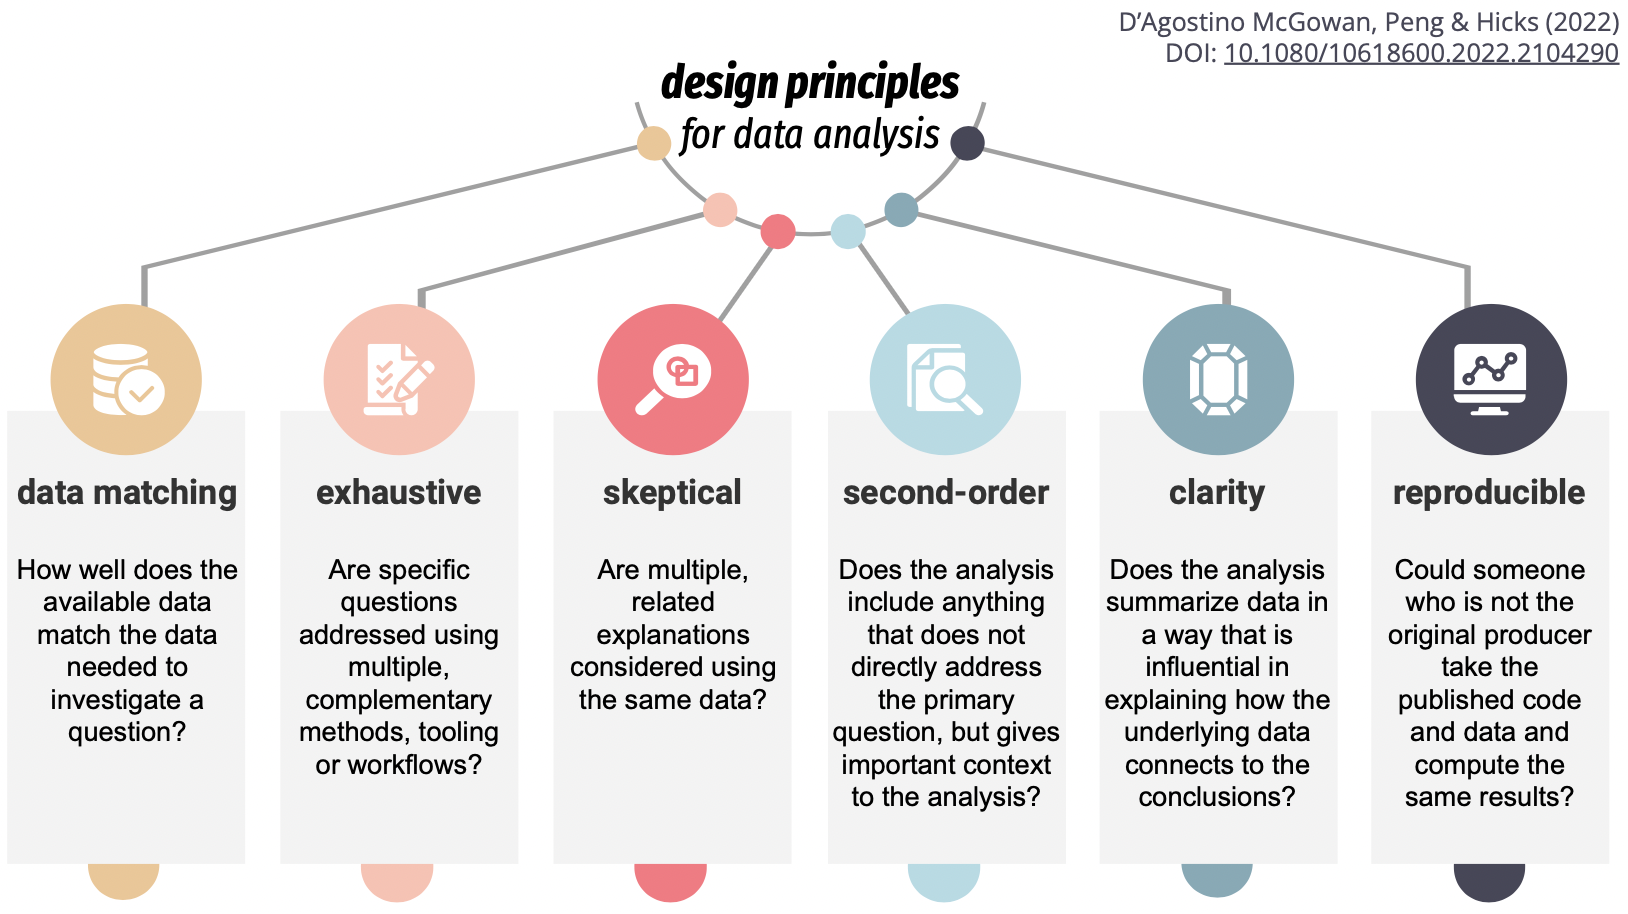
The data revolution has led to an increased interest in the practice of data analysis. While much has been written about statistical thinking, a complementary form of thinking that appears in the practice of data analysis is design thinking – the problem-solving process to understand the people for whom a product is being designed. For a given problem, there can be significant or subtle differences in how a data analyst (or producer of a data analysis) constructs, creates, or designs a data analysis, including differences in the choice of methods, tooling, and workflow. These choices can affect the data analysis products themselves and the experience of the consumer of the data analysis. Therefore, the role of a producer can be thought of as designing the data analysis with a set of design principles. This talk will introduce six design principles for data analysis and describe how they can be mapped to data analyses in a quantitative and informative manner. We also provide empirical evidence of variation of these principles within and between producers of data analyses. This will hopefully provide guidance for future work in characterizing the data analytic process.
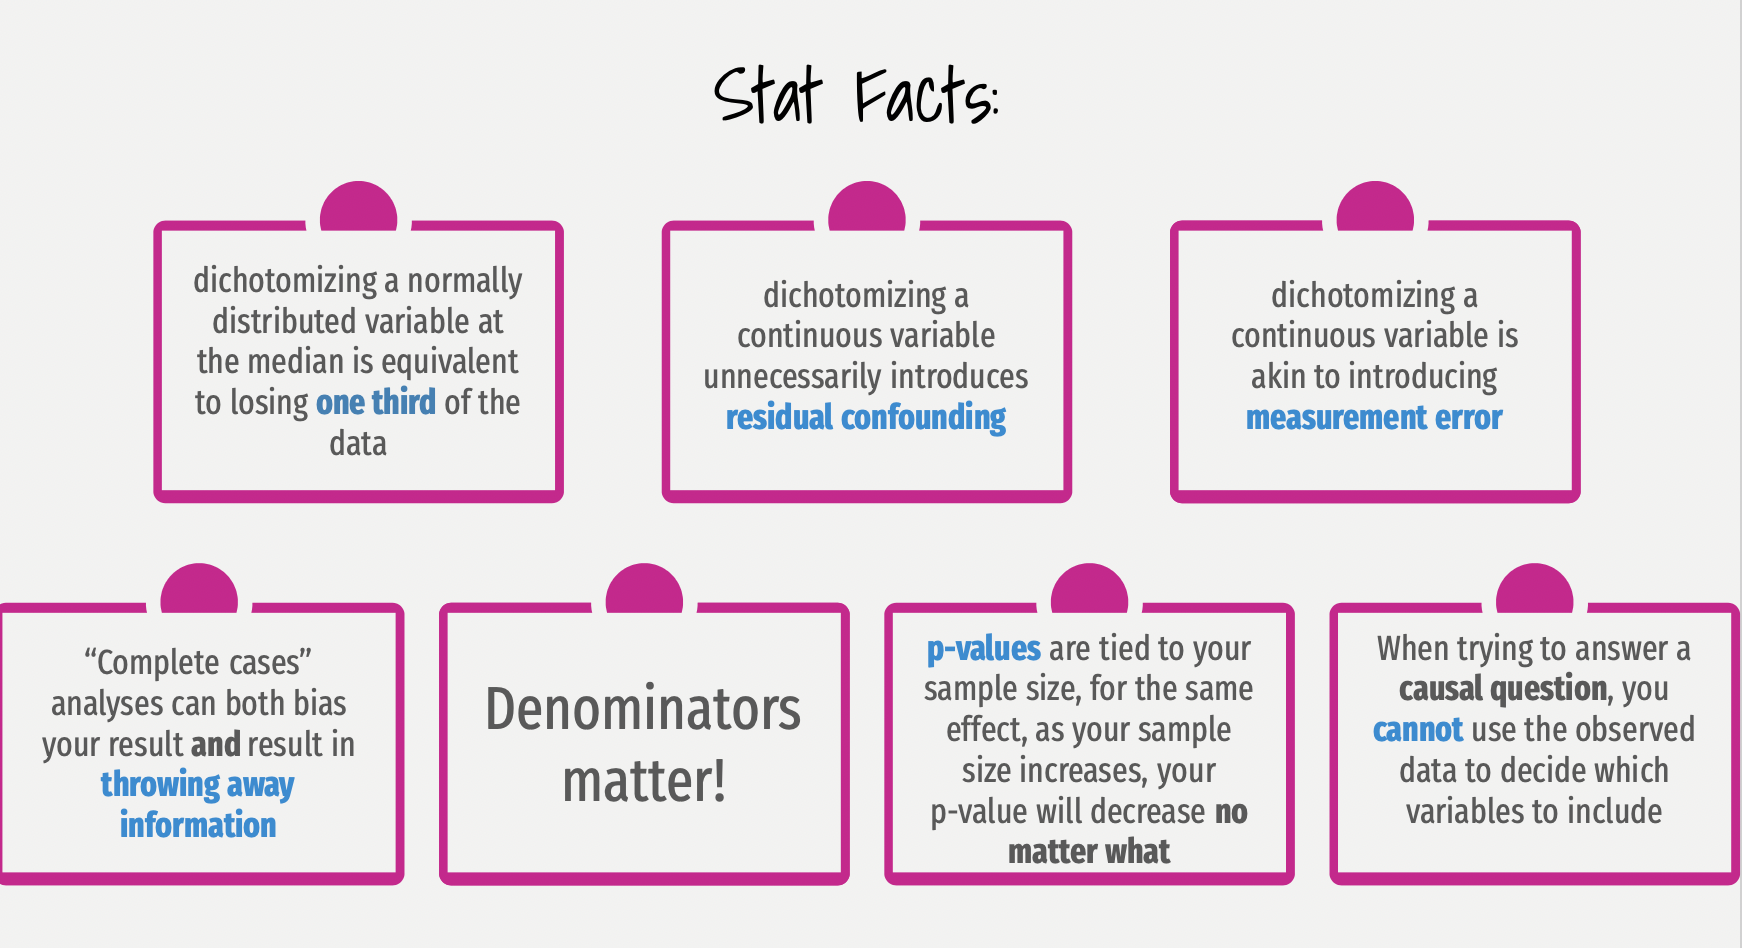
This talk will focus on best practices for using modern statistics in health sciences.
This 6 week series will cover causal inference model building and evaluation techniques. In this workshop, we’ll teach the essential elements of answering causal questions in R through causal diagrams, and causal modeling techniques such as propensity scores and inverse probability weighting. We’ll also show that by distinguishing predictive models from causal models, we can better take advantage of both tools. You’ll be able to use the tools you already know–the tidyverse, regression models, and more–to answer the questions that are important to your work.
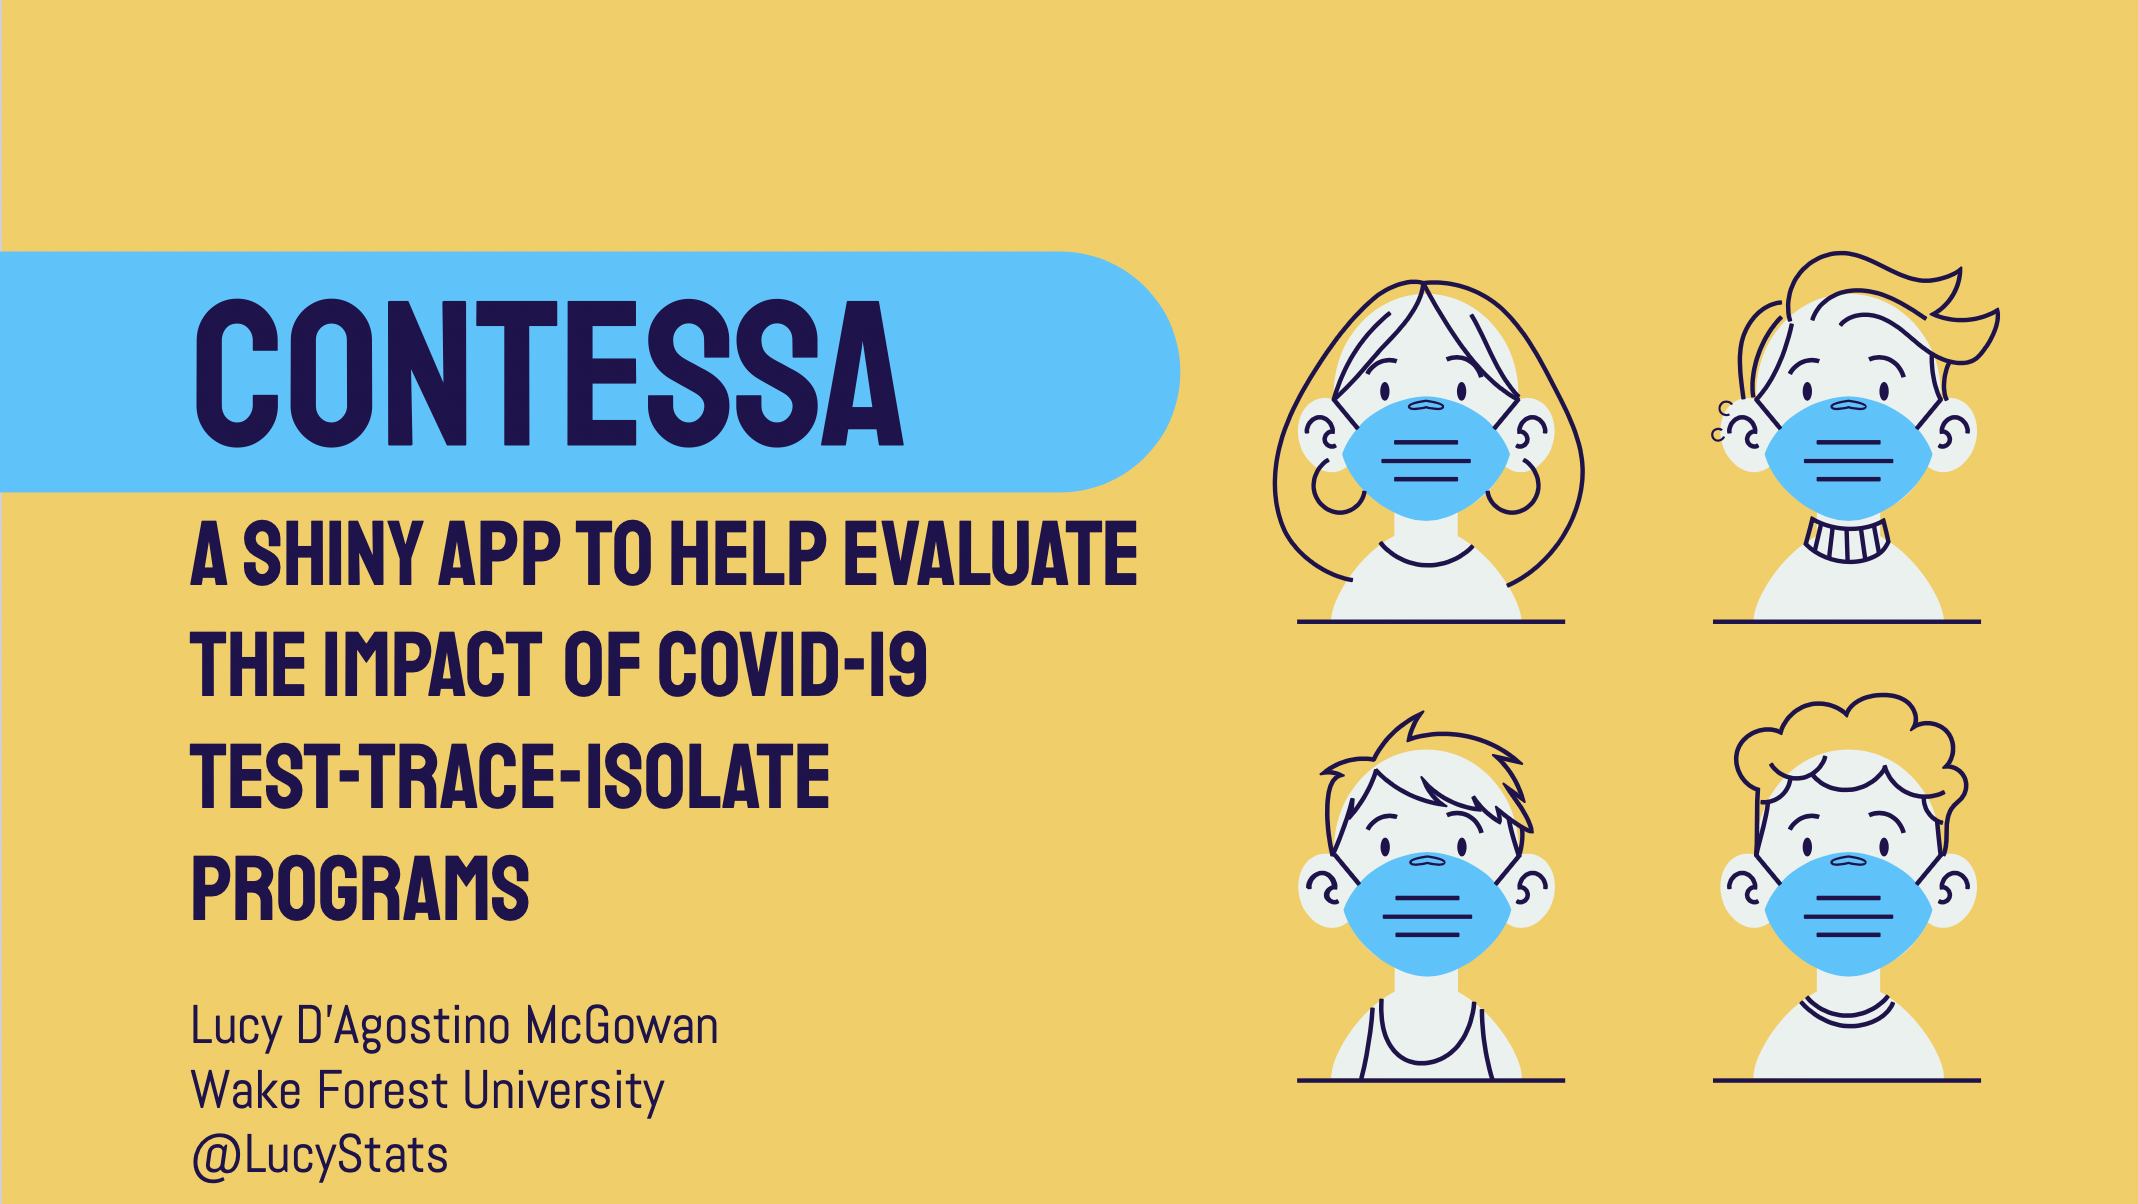
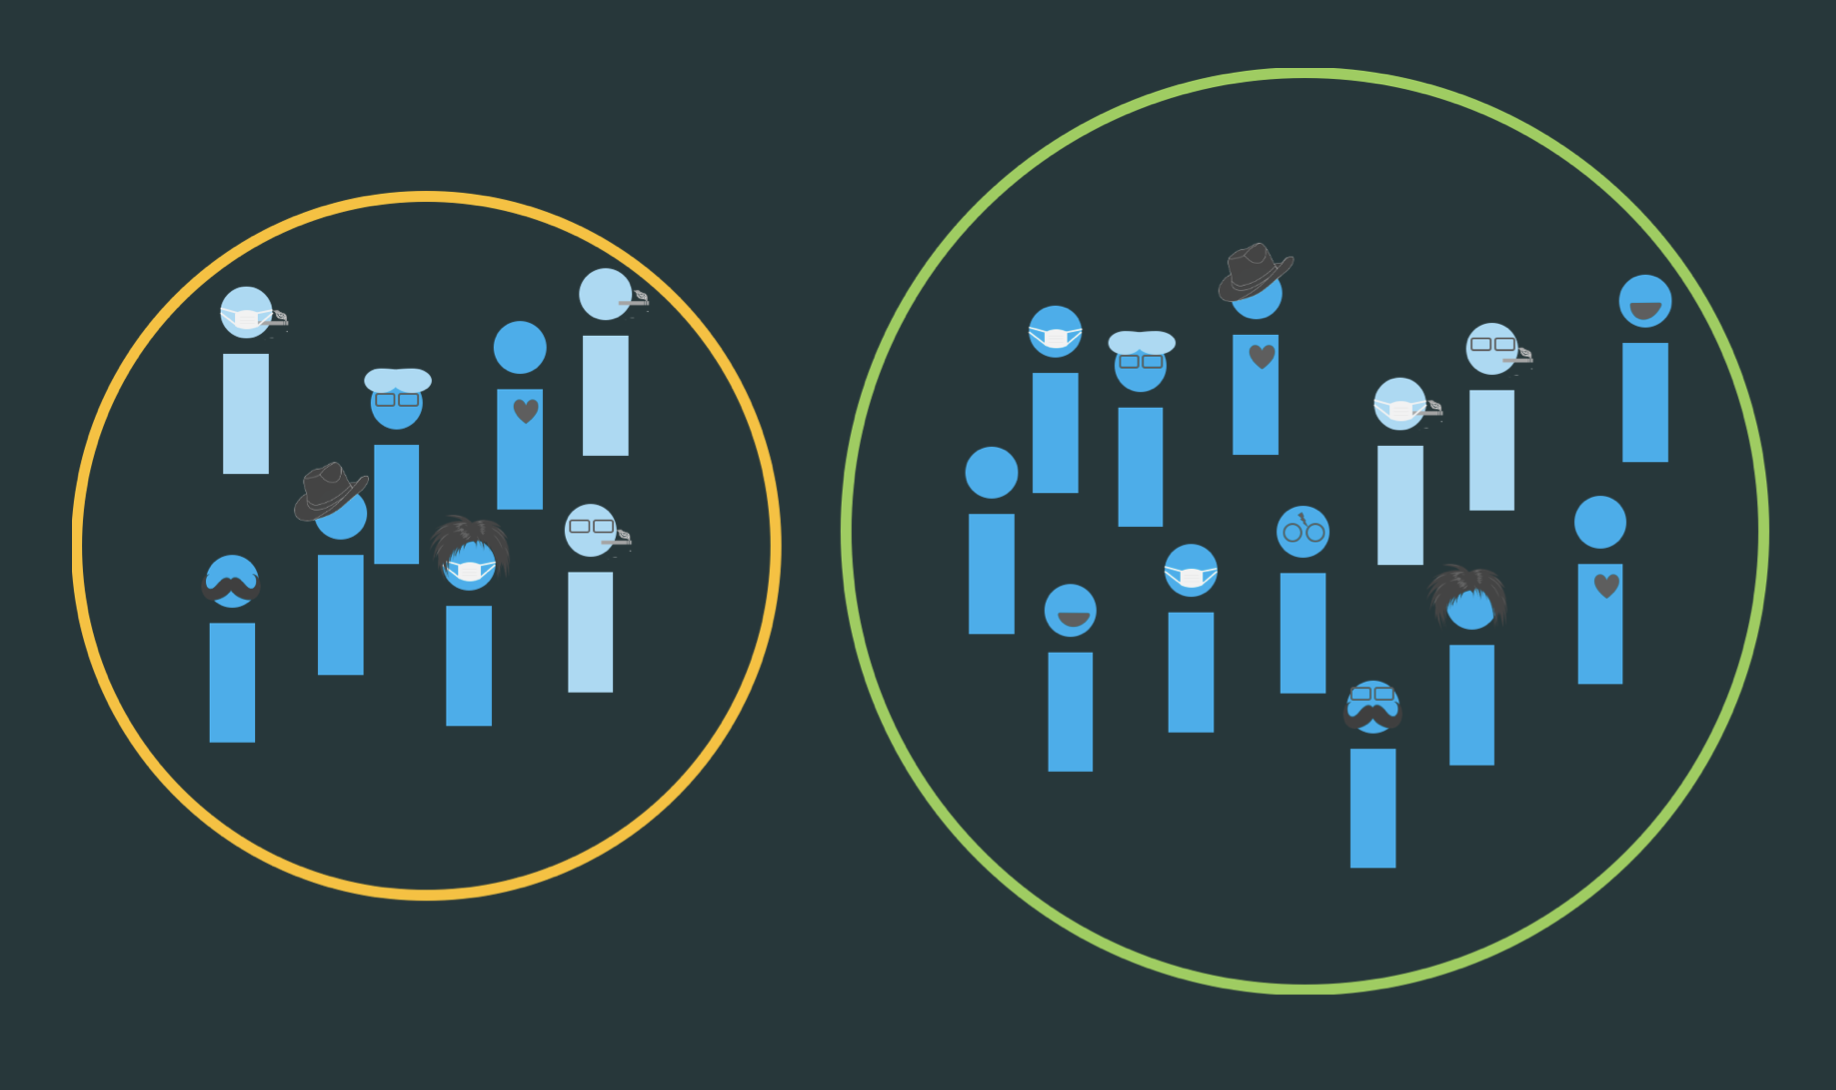
This talk will focus on an application, ConTESSA, along with the accompanying R package, tti, designed to help quantify the impact of contact tracing programs. The talk will walk through the technical aspects of the underlying model as well as highlight how R, and in particular shiny, were used to create this product.